Measuring Success in Revenue Cycle Management
In the healthcare industry, claims denials can account for up to 10% of all claims submitted, leading to significant revenue losses. Effective RCM is essential for minimizing these losses and ensuring that your practice operates efficiently. By tracking key performance indicators (KPIs), you gain valuable insights into the strengths and weaknesses of your revenue cycle. Let’s explore some essential KPIs and how measuring them can benefit your practice:
First Pass Resolution Rate (FPRR)
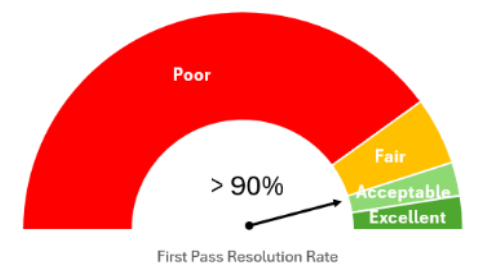
The FPRR measures the percentage of claims resolved on the first submission. A high FPRR indicates an efficient RCM process with fewer errors and less rework. Incorrect or missing data are common reasons for claim rejections. By improving your FPRR, you reduce the time and costs associated with reprocessing claims, leading to faster reimbursements and a stronger financial position. An ideal benchmark for this metric is 90% or higher.

Net Realization Rate
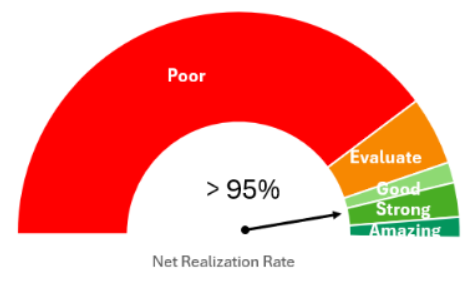
The net realization rate (NRR) represents the percentage of the “expected allowable” collected (i.e., gross charge less contractual adjustment, based on payer contracts). The amount collected is a combination of insurance and patient payments (e.g., copays, deductibles). This metric is vital for understanding how much of the expected revenue is being collected. An ideal benchmark is an NRR greater than 95%. By monitoring and improving your NRR, you ensure that your practice is maximizing its revenue potential and minimizing losses. A consistent 12-month rotating analysis is recommended for accurate assessment.

Denial Rate
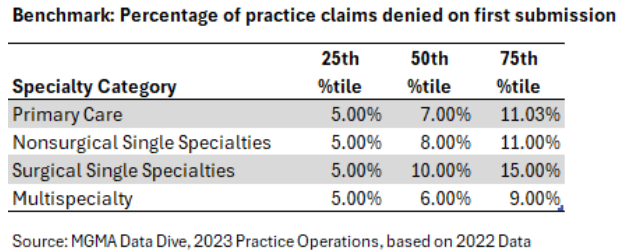
The denial rate is the percentage of claims denied by payers within a given period. High denial rates can indicate various internal issues, such as lack of prior authorization or incorrect claim information. By closely monitoring and addressing the reasons behind claim denials, you can significantly reduce revenue losses. Keeping your denial rate below five percent is a good objective, with the industry average ranging between five to ten percent.

Days in Accounts Receivable (A/R)
Days in A/R measures the average number of days it takes to collect a payment. Lower days in A/R indicate faster collection times and more bargaining power. This metric is essential for forecasting income and evaluating the efficiency of your RCM process. By reducing your days in A/R, you can improve cash flow, which is critical for maintaining financial stability and planning for future growth. The goal is to keep days in A/R below 50.

Cost to Collect
The cost to collect measures the expenses incurred in collecting revenue. This metric highlights the efficiency of your revenue cycle by comparing total revenue cycle costs to the total cash collected. By optimizing the collection process to minimize costs, your practice can enhance profitability. Tracking this metric helps identify areas where you can reduce administrative expenses and improve overall efficiency. The industry median cost-to-collect is around three percent.
By regularly analyzing these KPIs, you can identify inefficiencies, reduce costs, and improve overall productivity, resource allocation, customer satisfaction, and financial standing. Implementing efficient RCM practices not only boosts profitability but also allows for better resource allocation and improved patient satisfaction. Ultimately, a data-driven approach to RCM ensures that your practice is well-positioned for sustainable growth and success.
Interested in Learning More?
We would love to hear from you! Please reach out to us